Line Graph Maker
Create stunning line graphs effortlessly
Easily generate customizable line graphs for free, perfect for presentations, reports, and data visualization needs.
What is Line Graph Maker?
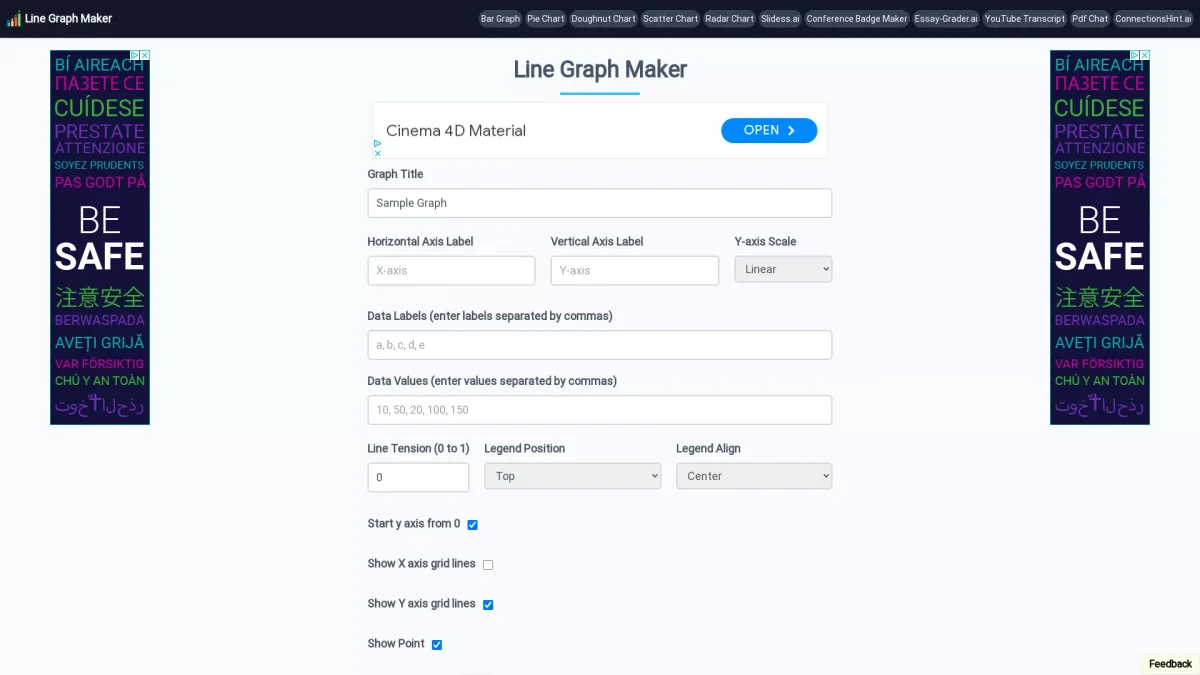
Line Graph Maker is a user-friendly online tool designed for creating customizable line graphs. Its main purpose is to simplify the process of visualizing data, making it accessible to everyone from students to professionals. By allowing users to input data labels and values, along with various customization options, this tool effectively addresses the need for clear and engaging data representation in various contexts. The key benefits of Line Graph Maker include its intuitive interface and versatility. Users can customize their graphs with titles, axis labels, scales, colors, and more, which enhances the presentation of data. This tool is ideal for educators, students, and business professionals who need to present data clearly and effectively, saving time and improving the impact of their visual communications.
Key Features
- Customizable graph titles and labels
- Multiple axis scale options
- Data points and labels input
- Line tension adjustment
- Download in various formats
- Grid line customization options
- Legend positioning flexibility
Who is it for?
- Students and educators
- Business analysts
- Researchers and scientists
- Marketing professionals
- Data visualization enthusiasts
Use Cases
1. Academic Presentations
Students can utilize Line Graph Maker to create visually appealing graphs for their academic presentations. By inputting their data, they can customize the graphs to effectively communicate their findings and enhance their presentations.
2. Business Reports
Business professionals can generate line graphs for reports, making it easier to visualize trends and performance metrics. This tool allows for quick customization, ensuring that the graphs align with corporate branding and reporting standards.
3. Data Analysis in Research
Researchers can use Line Graph Maker to create graphs that represent their data findings visually. This enhances the clarity of research papers and presentations, making complex data more understandable for audiences.
4. Marketing Campaign Tracking
Marketers can track the performance of campaigns over time using line graphs. By visualizing data trends, they can make informed decisions based on the effectiveness of their marketing strategies.
Pricing Plans
Pricing information not available on website. Please visit the official website for current pricing.
Frequently Asked Questions
1. Does Line Graph Maker allow free usage?
Yes, Line Graph Maker offers a free version that allows users to create line graphs without any hidden fees, making it accessible to everyone.
2. What customization options are available?
Users can customize graph titles, axis labels, scales, line colors, and tension levels. Additionally, options for grid lines and legend positioning are also available.
3. What file formats can I download my line graph in?
Line Graph Maker allows users to download their graphs in various formats, including PNG, JPG, and SVG, catering to different presentation needs.
4. Is there a limit on data points for graphs?
The website does not specify a limit on the number of data points you can input for your graphs, making it flexible for varying data sets.
Line Graph Maker Reviews & Ratings
Real user feedback and ratings for Line Graph Maker. See what the community thinks about this AI tool.
No reviews yet
Be the first to share your experience with Line Graph Maker